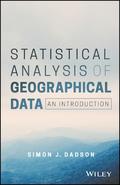
Statistical Analysis of Geographical Data
An Introduction

1. Auflage Mai 2017
264 Seiten, Softcover
Wiley & Sons Ltd
Kurzbeschreibung
An accessible and up-to-date introduction to the application of statistical analysis, Statistical Analysis of Geographical Data covers a wide range of topics, including uncertainty analysis, graphical and numerical description of datasets, probability, calculation of confidence intervals, hypothesis testing, collection and analysis of data using analysis of variance and linear regression. Taking a clear and logical approach, this book for geography students enhances the reader's understanding of theory by examining real problems with real data from the geographical literature that illustrate the important role statistics plays in geographical investigations.
Statistics Analysis of Geographical Data: An Introduction provides a comprehensive and accessible introduction to the theory and practice of statistical analysis in geography. It covers a wide range of topics including graphical and numerical description of datasets, probability, calculation of confidence intervals, hypothesis testing, collection and analysis of data using analysis of variance and linear regression. Taking a clear and logical approach, this book examines real problems with real data from the geographical literature in order to illustrate the important role that statistics play in geographical investigations. Presented in a clear and accessible manner the book includes recent, relevant examples, designed to enhance the reader's understanding.
1.1 The role of statistics in geography 9
1.1.1 Why do geographers need to use statistics? 9
1.2 About this book 11
1.3 Data and measurement error 12
1.3.1 Types of geographical data: nominal, ordinal, interval, and ratio 12
1.3.2 Spatial data types 13
1.3.3 Measurement error, accuracy and precision 15
1.3.4 Reporting data and uncertainties 17
1.3.5 Significant figures 18
1.3.6 Scientific notation (standard form) 19
1.3.7 Calculations in scientific notation 21
2 Collecting and Summarizing Data 23
2.1 Sampling methods 23
2.1.1 Research design 23
2.1.2 Random sampling 25
2.1.3 Systematic sampling 27
2.1.4 Stratified sampling 27
2.2 Graphical summaries 28
2.2.1 Frequency Distributions and Histograms 28
2.2.2 Time-series plots 32
2.2.3 Scatter plots 32
2.3 Summarizing data numerically 34
2.3.1 Measures of central tendency: mean, median and mode 34
2.3.2 Mean 34
2.3.3 Median 35
2.3.4 Mode 35
2.3.5 Measures of dispersion 38
2.3.6 Variance 39
2.3.7 Standard deviation 40
2.3.8 Coefficient of variation 41
2.3.9 Skewness and kurtosis 43
3 Probability and Sampling Distributions 47
3.1 Probability 47
3.1.1 Probability, statistics, and random variables 47
3.1.2 The properties of the normal distribution 48
3.2 Probability and the normal distribution: z-scores 49
3.3 Sampling distributions and the central limit theorem 52
4 Estimating Parameters with Confidence Intervals 56
4.1 Confidence intervals on the mean of a normal distribution: the basics 56
4.2 Confidence intervals in practice: the t-distribution 57
4.3 Sample size 59
4.4 Confidence intervals for a proportion 60
5 Comparing Datasets 62
5.1 Hypothesis testing with one sample: general principles 62
5.1.1 Comparing means: one-sample Z test 63
5.1.2 P-values 67
5.1.3 General procedure for hypothesis testing 69
5.2 Comparing means from small samples: one sample t-test 69
5.3 Comparing proportions for one sample 71
5.4 Comparing two samples 73
5.4.1 Independent samples 73
5.4.2 Comparing means: t-test with unknown population variances assumed equal 73
5.4.3 Comparing means: t test with unknown population variances assumed unequal 78
5.4.4 T test for use with paired samples (paired t-test) 81
5.4.5 Comparing variances: F test 85
5.5 Non-parametric hypothesis testing 86
5.5.1 Parametric and non-parametric tests 86
5.5.2 Mann-Whitney U test 87
6 Comparing distributions: the Chi-squared test 92
6.1.1 Chi-squared test with one sample 92
6.1.2 Chi-squared test for two samples 95
7 Analysis of Variance (ANOVA) 102
7.1 One-way analysis of variance 102
7.2 Assumptions and diagnostics 113
7.3 Multiple comparison tests after analysis of variance 115
7.4 Non-parametric methods in the analysis of variance 119
7.5 Summary and further applications 121
8 Correlation 124
8.1 Correlation analysis 124
8.2 Pearson's product-moment correlation coefficient 125
8.3 Significance tests of correlation coefficient 128
8.4 Spearman's rank correlation coefficient 129
8.5 Correlation and causality 131
9 Linear regression 135
9.1 Least-squares linear regression 135
9.2 Scatter plots 136
9.3 Choosing the line of best fit: the 'least-squares' procedure 138
9.4 Analysis of residuals 141
9.5 Assumptions and caveats with regression 144
9.6 Is the regression significant? 144
9.7 Coefficient of determination 148
9.8 Confidence intervals and hypothesis tests concerning regression parameters 150
9.8.1 Standard error of the regression parameters 150
9.8.2 Tests on the regression parameters 151
9.8.3 Confidence intervals on the regression parameters 153
9.8.4 Confidence interval about the regression line 153
9.9 Reduced major axis regression 154
9.10 Summary 155
10 Spatial Statistics 159
10.1 Spatial data 159
10.1.1 Types of spatial data 159
10.1.2 Spatial data structures 160
10.1.3 Map projections 164
10.2 Summarizing spatial data 170
10.2.1 Mean centre 170
10.2.2 Weighted mean centre 171
10.2.3 Density estimation 172
10.3 Identifying clusters 173
10.3.1 Quadrat test 173
10.3.2 Nearest neighbour statistics 175
10.4 Interpolation and plotting contour maps 176
10.5 Spatial relationships 176
10.5.1 Spatial autocorrelation 176
10.5.2 Join counts 177
10.5.3 Moran's I 184
11 Time Series Analysis 189
11.1 Time series in geographical research 189
11.2 Analysing time series 190
11.2.1 Describing time series: definitions 190
11.2.2 Plotting time series 190
11.2.3 Decomposing time series: trends, seasonality and irregular fluctuations 194
11.2.4 Analysing trends 194
11.2.5 Removing trends ('detrending' data) 200
11.2.6 Quantifying seasonal variation 200
11.2.7 Autocorrelation 202
11.3 Summary and further reading 204
12 Bibliography 205
13 Introduction to the R package (Appendix A) 208
14 Statistical Tables (Appendix B) 209


